Again, this will go better if you’ve read part 1 and part 2 of this series!
We’re going to combine two techniques here. First, we’ll use the “Sort by Selection” method to order the vertices. Second, instead of using a text editor, we’ll use a spreadsheet to manipulate the data!!
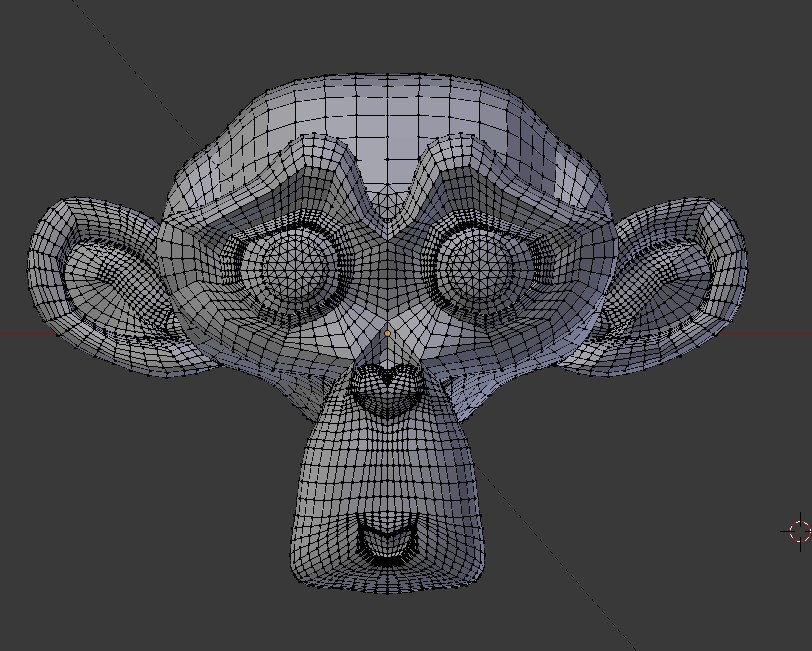
We’ll use Suzanne, once again, as our model. We’ll go into “Edit” mode and subdivide the mesh a couple times so we have more vertices to work with.
That accomplished, we’ll select a few of the vertices at the top of Suzanne’s head, and, after that, we’ll go to the “Mesh” menu, choose “Sort Elements”, and then sort by “Selection”.
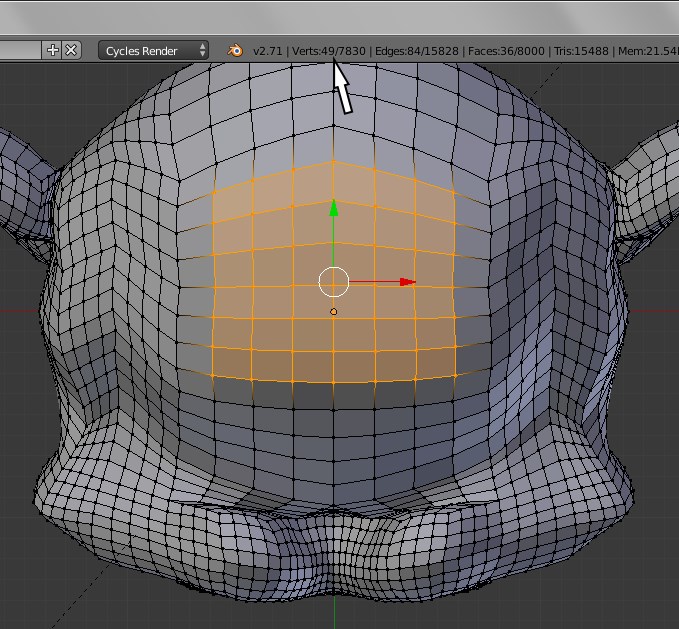
Using the “visualize vertices” addon that we introduced in the last set of notes, we can now see that the vertices we selected are in indices 0 through 48 ( a total of 49).
We then export the mesh in our usual fashion as an .obj file, change the extension to .txt, and open it in a spreadsheet! I’m using LibreOffice Calc, so I’m given the option of using spaces to separate the fields, this results in the x,y, and z coordinates being placed correctly in their separate columns.
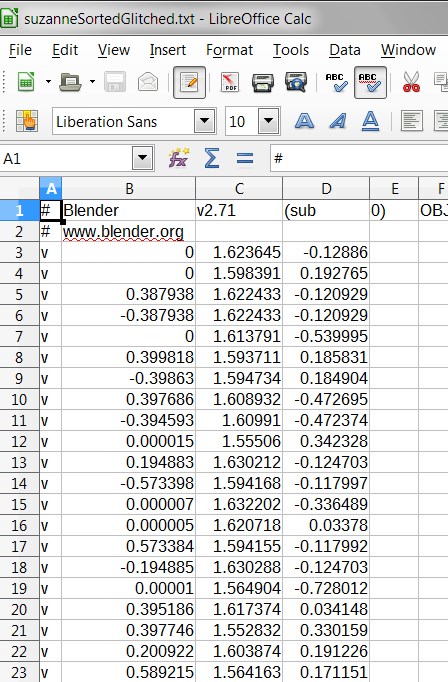
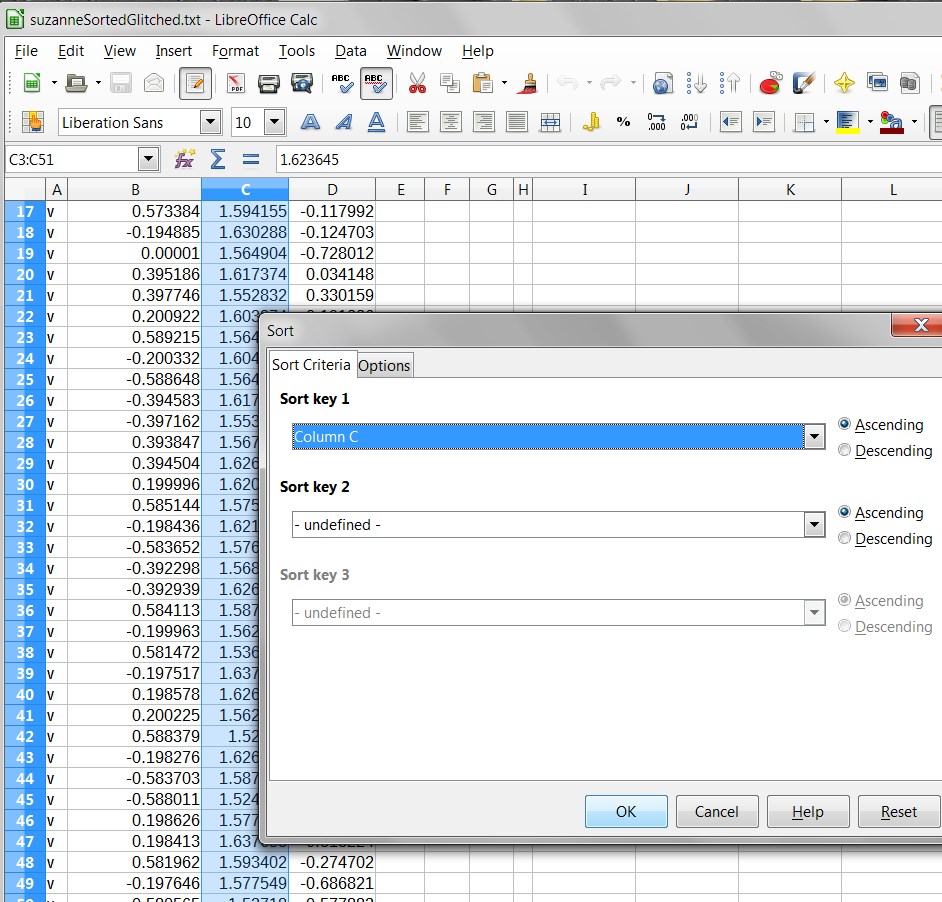
We’re now going to do something that would not have been possible using a text editor. We’ll select the first 49 coordinates in the “C” column.. those represents the “y” values for the vertices, which is the “up” direction. ( A note here.. most 3d programs treat the “y” axis as up, but Blender uses the “z” axis for up! When exporting as an .obj file from Blender, in the export options, choose “Y Up” and “Z Forward”.)
In this case, sort Column “C” by “Ascending”.
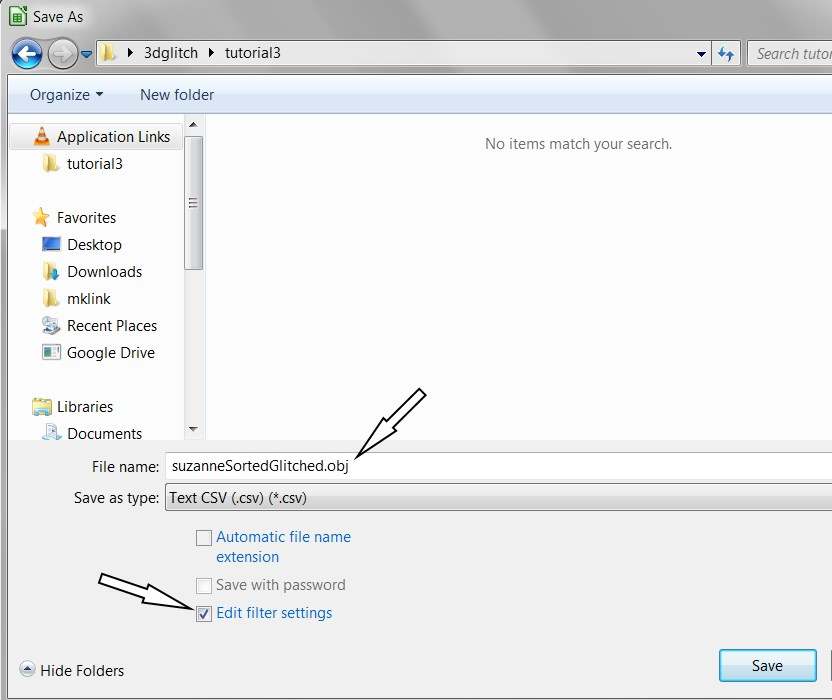
We’ve now “glitched” our file, but we have to take special care when saving it and changing it back into an .obj file. Choose to save as a text “.csv” file. In Calc, you’ll need to check the “Edit filter settings” option. You can also uncheck “Automatic file name extension” options, and then change the file extension from “.csv” to “.obj”.
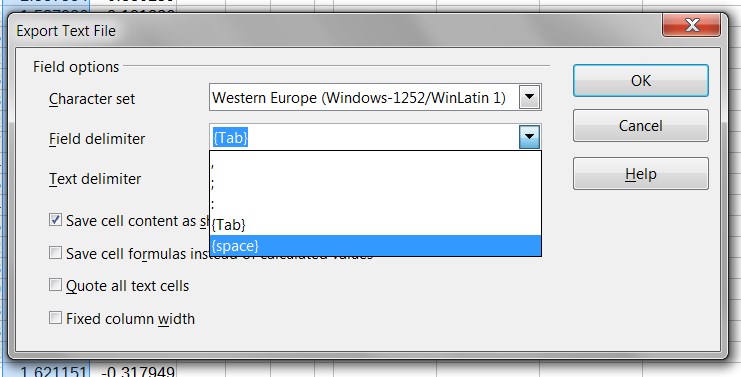
Be sure to change the field delimiter to “space”:
We’ll now take a look at our glitched file in Meshlab:
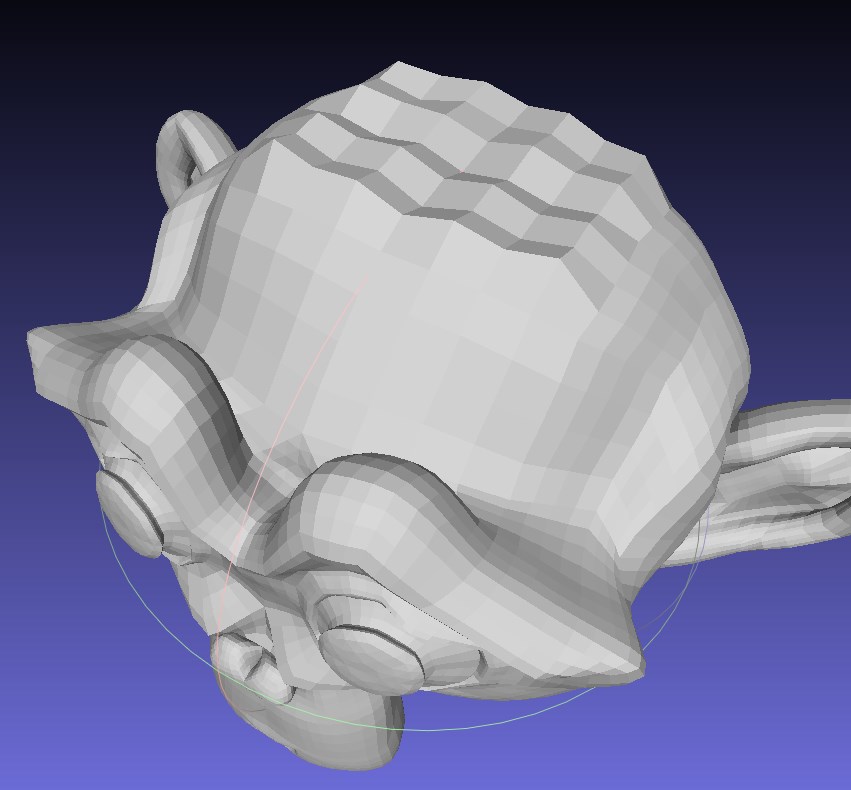
Look at that strange regular pattern of peaks and valleys on top of Suzanne’s head! What is happening here?
Let’s look at a comparison of the column containing the values of the “y” coordinates before and after we sorted them:
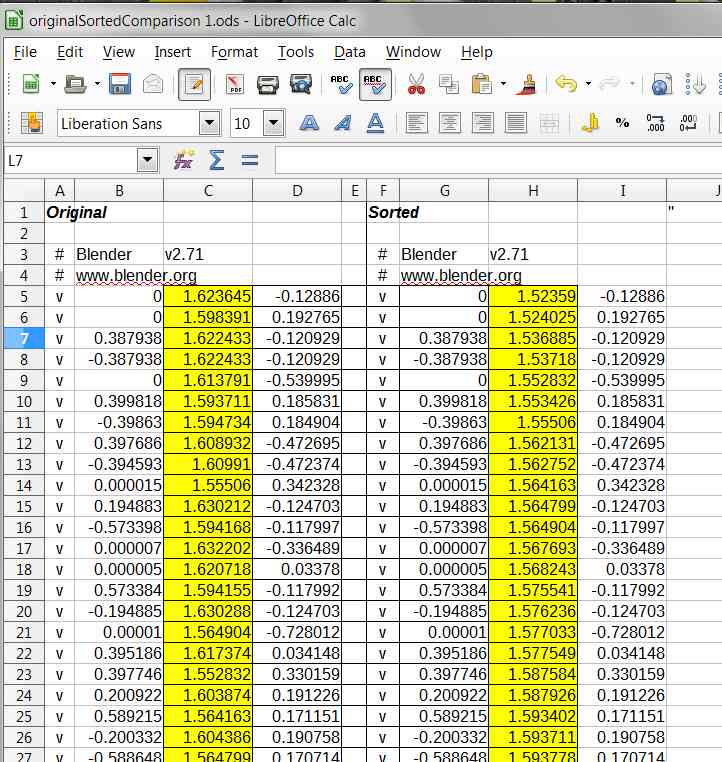
Note that before we did our sort in the spreadsheet, the vertex at index 0 (on line 5 of the spreadsheet due to the header info above it) would be at the very top of Suzanne’s head.. at the highest “y” position. After we sorted the “y” axis in the spreadsheet in ascending order, that 0 index vertex was now at the lowest position on the “y” axis relative to the other vertices we selected. Each of the subsequent vertices we selected would be at the next slightly higher position, and the last vertex at index 48 will now be at the highest relative position.
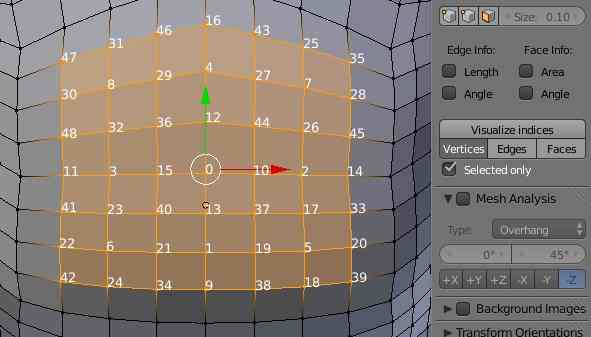
Let’s look again at the picture of the selected vertices with their index positions displayed.. this time with a visualization of the distribution of those indices:

Note how the pattern skips, hopscotch fashion, so the next indexed vertex is never immediately “spatially” adjacent in the mesh to the vertices that are just before and after it in the index order.
The “hopscotch” arrangement of the vertices results in the regular “high-low” alternation along the “y” axis that we see saw above. After the sort in the spreadsheet, the vertices reached during the first half of the traverse have all been assigned the lowest “y” values, and the vertices spatially in between them on the mesh, being visited last, have been assigned the highest “y” values. Of course, the order of the indices would have been different if we’d chosen a different method of sorting them back when we were in Blender.
This method of selecting chunks of the 3 columns representing the x, y, and z coordinates, and then sorting them various ways – sometimes ascending, sometimes descending, sometimes sorting one column separately, sometimes sorting more than one column using multiple keys – can produce some interesting results:

There are many other curious things one can do with spreadsheets.. easily cutting and pasting between the columns, applying formulas.. however, sooner or later the limitations of spreadsheets will get in the way. At that point we’ll need to use a real scripting language to manipulate the date.. but that will come in a future post.
Before that, though, we’ll be looking at glitching the texture coordinates of the .obj file.. these control how a 2d image is mapped to the 3d surface of the mesh.. and now you’re ready to move on to the next section!